A stock trading chart may look confusing at first. Green and red candles, fluctuating lines, price levels, and volume bars appear together on the screen. Yet all these elements are simply different ways of presenting information about how a security’s price has changed.
For someone exploring India’s stock markets, learning to read a chart is a useful financial literacy skill. Charts help explain historical price movements, trading activity, and the relationship between buyers and sellers.
Reading a trading chart means understanding what happened to a security’s price during a particular period, rather than assuming the chart can predict what will happen next.
Beginners can develop this understanding by learning a few essential components before exploring technical indicators or complex chart patterns.
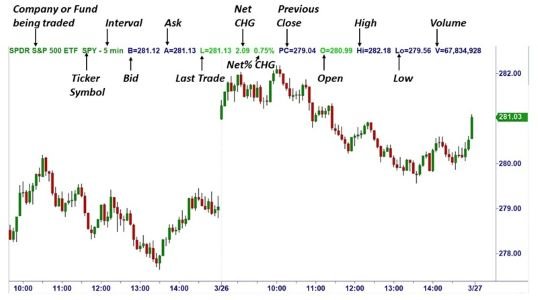
Start With the Two Axes of a Trading Chart
Every basic price chart contains two important reference points.
The horizontal axis represents time, while the vertical axis represents price.
For example, a chart displaying shares listed on the National Stock Exchange (NSE) might show price movements throughout a trading session.
Moving from left to right reveals how the price changed over time.
Moving upward or downward indicates the price level.
Before interpreting anything else, identify:
- Security name: The stock, index, or other instrument displayed.
- Price scale: The values shown along the vertical axis.
- Time period: The duration covered by the chart.
- Chart interval: The amount of time represented by each data point or candle.
- Trading volume: The quantity traded during a particular period, when available.
These details provide the foundation for understanding the information displayed.
Understand the Difference Between Line and Candlestick Charts
Not every chart presents prices in the same format.
A line chart typically connects selected prices, commonly closing prices, across different periods.
It provides a relatively simple picture of the overall direction.
Candlestick charts contain more information because each candle represents four prices: open, high, low, and close.
These are collectively known as OHLC values.
Candlestick charts are widely used because they show how prices moved within individual time intervals.
However, beginners may find line charts easier when initially examining longer-term movements.
How to Read Your First Candlestick
Imagine a hypothetical Indian stock with the following prices during one trading interval:
| Price Component | Value |
| Opening price | ₹240 |
| Highest price | ₹248 |
| Lowest price | ₹237 |
| Closing price | ₹245 |
The candle’s body represents the difference between the opening and closing prices.
Thin lines extending above and below the body, called wicks or shadows, show the highest and lowest prices.
Because the closing price exceeds the opening price, the candle is generally displayed in green.
If the closing price were lower than the opening price, it would commonly appear red.
Chart colours can be customised, so the price values remain more important than the colours themselves.
A single candle describes price behaviour during one interval. It does not establish what the next candle will do.
Why Chart Timeframes Change the Picture
The same stock can appear to be rising on one chart and falling on another.
This happens because charts can display different timeframes.
A five-minute chart shows short-term fluctuations, while a daily chart summarises an entire trading session within each candle.
A weekly chart compresses several trading sessions into one candle.
For example, a stock might decline during the morning but still finish the week above its previous weekly closing price.
Neither chart is necessarily incorrect.
They simply describe different periods.
Understanding the selected timeframe prevents beginners from confusing temporary price movements with longer-term trends.
Recognising Trends Without Overcomplicating the Chart
A trend describes the general direction of price movement.
An upward trend commonly involves progressively higher peaks and higher troughs.
A downward trend may show lower peaks and lower troughs.
When prices fluctuate within a relatively narrow range without a clear direction, the market may be described as moving sideways.
These descriptions are useful, but they are not guarantees.
A rising trend can reverse, and a sideways market can experience sudden price movements.
Trend identification is therefore best understood as a description of observed behaviour rather than a reliable prediction.
What Trading Volume Adds to Price Analysis
Price tells only part of the story.
Volume shows how many shares or contracts were traded during a specified interval.
On many Indian trading platforms, volume appears as vertical bars beneath the price chart.
Higher volume indicates greater trading activity, but it does not automatically mean that prices will rise.
A stock may experience unusually high volume during a price decline, following company announcements, or during periods of uncertainty.
Volume becomes more informative when considered alongside price changes and relevant market developments.
Understanding Support and Resistance Levels
Support and resistance are commonly used concepts in technical analysis.
Support refers to an area where buying interest has previously been sufficient to slow or reverse a decline.
Resistance describes an area where selling interest has previously limited upward movement.
These are not fixed barriers.
Prices can move through either level, and historical reactions do not guarantee future behaviour.
Beginners should also understand that analysts may identify slightly different levels when examining the same chart.
Common Chart-Reading Mistakes Beginners Make
Misinterpreting chart information can create unrealistic expectations.
Some common mistakes include:
- Assuming every green candle signals continued price increases.
- Treating historical support levels as guaranteed protection.
- Ignoring the selected timeframe.
- Confusing high trading volume with guaranteed profitability.
- Using too many indicators without understanding their purpose.
- Drawing conclusions from a single candle.
- Overlooking corporate actions that affect historical price comparisons.
Charts also cannot independently explain every price movement.
Company announcements, economic developments, and broader market conditions may provide important context.
A Simple Way to Practise Reading Charts
Beginners can use historical NSE or BSE chart data to develop observational skills without placing transactions.
Start by selecting a familiar listed company and examining its daily chart.
Identify the opening and closing prices, observe the highest and lowest points, and compare trading volumes across sessions.
Then examine the same security using a weekly timeframe.
Notice how the overall picture changes.
This exercise encourages careful observation without requiring predictions or financial exposure.
Frequently Asked Questions
Q1. Which trading chart is easiest for beginners to understand?
A: A line chart is generally the easiest starting point because it clearly displays price direction. Candlestick charts provide additional information about opening, closing, highest, and lowest prices.
Q2. What do green and red candles mean in trading?
A: A green candle usually indicates that the closing price exceeded the opening price during the selected interval. A red candle generally indicates the opposite. Colours may vary according to platform settings.
Q3. Can trading charts predict future stock prices?
A: No. Charts display historical and current market information. Although analysts use them to identify patterns, future price movements remain uncertain.
Q4. What is the difference between a daily chart and a five-minute chart?
A: A daily candlestick represents one trading session, while a five-minute candlestick represents five minutes of trading activity. Different intervals highlight different aspects of price behaviour.
Q5. Is technical analysis necessary to understand stock charts?
A: No. Beginners can understand basic price movements, timeframes, candlesticks, and volume without learning advanced technical analysis. These fundamentals provide a useful starting point for financial market education.